Managing and Tracking ML experiments

Atharva
@kaggle 4x Expert
One of the least taught skill in machine learning is how to manage and track machine learning experiments effectively. Once you get out of the shell of beginner-level projects and get into some serious projects/research, experiment tracking and management become one of the most crucial parts of your project.
However, no course teaches you how to manage your experiments in-depth, so here I am trying to fill in the gap and share my experience on how I track and manage my experiments effectively for all my projects and Kaggle competitions.
In this post, I would like to share knowledge gained from working on several ML and DL projects.
- Need for experiment tracking
- Conventional ways for experiment tracking and configuration management
- Trackables in a machine learning project
- Experiment tracking using Weights and Biases
- Configuration Management with Hydra
Note: This is my way of tracking experiments I’ve developed over the years, some ways might work for you and some won’t, so read the complete article and incorporate the ideas you liked the most and you think would benefit your project.
Let’s get started.
Why do we need experiment tracking?
You might ask this question, why do we need experiment tracking in the first place?
The simple answer is that as machine learning practitioners, we invest a significant amount of time and effort to improve our solutions. Thus, you might iteratively change the model architecture, dataset parameters, evaluation metrics, etc. You can remember the changes you made for at most 4-5 experiments. After that, it becomes a complete mess. It's hard to remember all the configurations that went into a particular run and what changes made positive or negative improvements in your evaluation metrics (unless you are a superhuman :P). Modern Deep Learning architectures have 100s of parameters that the user has to define, making them much harder to remember.
Thus, there’s a need for a system that can manage and track all your experiments, so that you can focus on the task at the hand and not on remembering and worrying about the other stuff.
What are the trackables in a machine learning project?
After understanding the importance of tracking experiments, the next question you might have is what should we track for a machine learning project?
Here are some of the things that you might want to track
- Parameters: model architecture, hyperparameters
- Jobs/Routines: pre-processing routine, training and validation routine, post-processing routine, etc
- Artifacts: datasets, pre-processed datasets, model checkpoints, etc
- Metrics: training and evaluation loss, metrics
- Model-specific parts: optimizer state, gradients over the course of training, etc
- Metadata: experiment name, type of experiment, artifact locations (e.g. S3 bucket), run summary, configuration, etc
- Code: the state of the code when the experiment was run
- Hardware part: type of CPU or GPU instance, CPU/GPU usage, network usage, etc
Before diving into the core of this blog, I would like to discuss the problems with conventional ways of tracking experiments people generally follow, so that you would clearly see the benefits of the ways I would be discussing further in this blog post.
Experiment tracking - conventional techniques
- Writing down with a pen and paper: The most obvious way is to write the configuration and changes on a paper, however, there is a clear disadvantage in this approach, as you might make errors while writing and if you want to search or see a particular experiment, then it’s not at all easily searchable in a pile of pages. Also, it involves a lot of manual work and it’s not easy to keep writing about 100s of experiments.
- Using Excel or Google Sheets: Well, this seems to be a more structured way of tracking your experiments than the previous one, but still, it has the same problem of making errors while writing or copy-pasting the exact configurations in a spreadsheet. Although this stores all your experiment’s configurations digitally and you can easily search through it, this method involves a lot of manual work of typing or copy-pasting the exact configuration and structuring them into a spreadsheet which leads to wastage of time deviating you from the actual task at hand.
Configuration Management - conventional techniques
Tracking experiments is one part and how you pass the configuration to your codebase is another. Configuration management is one of the most crucial parts of managing and tracking experiments effectively. For most of the parts in your machine learning experiments, the code would be almost the same, while the changes would be mostly in the model parameters, dataset parameters, etc.
As there can be 100s of parameters that you might need to pass into your codebase to run a particular experiment, it’s a good idea to separate your configuration (all the tuneable and changeable parameters) from your actual code. I have seen many people making the mistake of hard-coding the parameters, and data paths in the code itself. While this might work for smaller projects, it can become a complete mess as your project size and team size grow. Your code should be portable to any system with minimal changes.
There are many ways of managing configurations in a way that it’s separated from the actual code which allows to easily change parameters to run different experiments.
Here I discuss some of the most commonly used ways of handling configurations in a project and the problems associated with them and how they can be solved by an open-source package by Meta Research called Hydra.
Argparse
One of the most common ways to pass all the configuration to your code-base is with the help of the built-in Python module, argparse. This module makes it easy to write user-friendly command-line interfaces. Argparse is a great way to pass configuration via command-line for small projects, however, it becomes quite complex and hard to maintain, when the project size increases. And it becomes a pain to write all the arguments in a command line to run your experiment. For instance, see the below code snippet directly taken from PyTorch ImageNet Training Example. Although the example is quite minimal, the number of command-line flags is already high. Ideally, some of these command-line arguments should be grouped together logically, but there's no easy and quick way to do that.
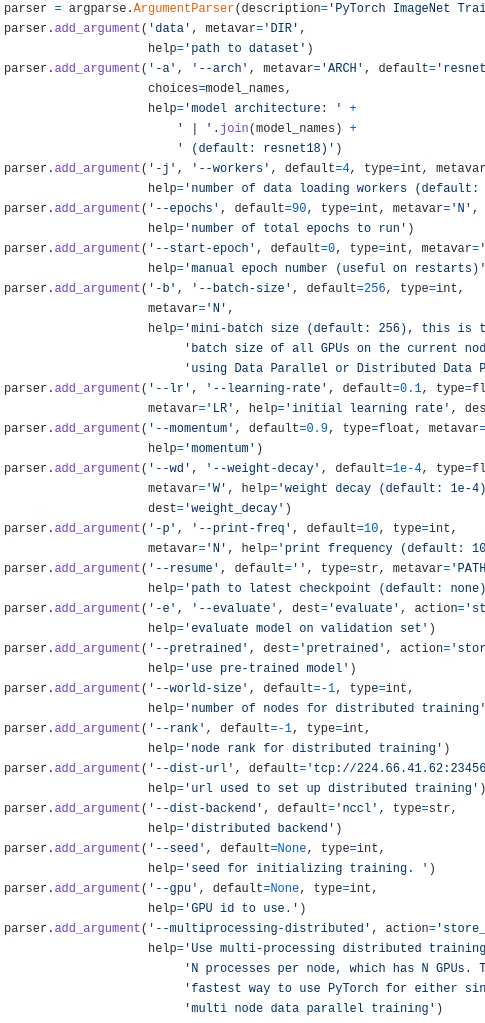
Snippet from PyTorch ImageNet Training Example
YAML files
The other most commonly used format to specify all your run arguments is to write them in a YAML file. If you don't know about YAML, it's just a human-readable data serialization language. To learn more about YAML you can refer to this article.
Here, you can instantly see some advantages compared to the previous argparse based configuration management. The first advantage is that we don’t need to type all the configurations again and again on the command-line or repeatedly make bash scripts to run different settings of experiments. Another advantage is that we can group similar types of items together.
For instance, see the snippet given below, all the data-related stuff goes into the data key, all the model-related stuff goes into the model key, etc. Furthermore, we can even nest different types of keys. In the snippet below, model is a key that has all the model-related stuff, and even in the model key, we can have separate keys for the encoder and decoder. You can pretty much define any type of data structure within YAML files and when read into Python it’s just a dictionary of dictionaries (nested dictionaries). You can refer to this article to learn how to use different data types in YAML files.
data:
    train_path: '/path/to/my/train.csv'
    valid_path: '/path/to/my/valid.csv'

model:
		encoder:
			dimension: 256
			dropout: 0.2
		decoder:
			dimension: 512
			dropout: 0.1

trainer:
	learning_rate: 1e-3
	train_batch_size: 16
	val_batch_size: 16
However, this is not the end of the story for YAML files. Suppose, you want to run lots of experiments and you want a way to remember or save the YAML file used for each experiment. One way to track all configuration files is to name the experiments meaningfully and accordingly name the YAML file as the experiment name.
For example: let’s say you are training transformer-based models for some NLP problem, then you might name the YAML file for a particular run as experiment-number_model-name_short-run-description.yaml.
Suppose, I am training a roberta-base model with gradient accumulation steps of 2, then I can name the experiment file as 0_roberta-base_grad-accum2.yaml. This might seem a good way for now, but you end up with a pile of YAML files and most of them become useless as you update your code continuously. You can’t keep up updating previous configuration files to be in sync with your current code-base. Also, it’s often hard to differentiate between these files as most of them appear to be of the same name and content and it’s hard to determine the change associated with each of them.
This was the approach I used in the past and honestly faced a lot of problems with it. But lucky for us, there's a better and cleaner way to deal with configuration files and that is achieved by Hydra, an open-source framework by Meta Research (formerly FaceBook Research), that aims to simplify configuring complex applications.
First, let’s see how configuration can be managed elegantly with the help of Hydra, and then we will see how the experiments can be tracked and managed with Weights and Biases.
Configuration management with Hydra
Over a year ago, MetaAI announced that they are re-engineering their platforms to be more modular and interoperable. Hydra is one of the major components of the re-engineering process to handle all of their configuration needs.
The main idea behind hydra is that you can compose multiple config files into a single master configuration file, and everything in the composed config can be overridden through the command-line.
Although this blog is not aimed to provide a complete and comprehensive guide for Hydra, still I will try to highlight its most important functionalities, and after reading this blog you can learn and experiment with it on your own by referring their documentation.
A basic example of Hydra configuration
Say you have this config for a dataset in a YAML file named as config.yaml:
dataset:
	name: cifar10
	path: /home/datasets/cifar10
Here's how you can read the file from your python script to enable hydra features
import hydra
from omegaconf import DictConfig

@hydra.main(config_path="config.yaml")
def my_app(cfg: DictConfig) -> None:
		print(cfg.pretty())

if __name__ == "__main__":
		my_app()
The decorator hydra.main() takes in the path where your master config.yaml file is stored.
Hydra is built on top of OmegaConf, which means that you can use all the features of OmegaConf, for example: variable interpolation is one of the moist useful features of OmegaConf.
If you don’t know about OmegaConf, it's a YAML-based hierarchical configuration system. To learn more about OmegaConf, you can read their documentation.
To access a particular key you can either use the dot notation or python dictionary notation as shown below
# To access the dataset key from the above example

cfg.dataset
# OR
cfg['dataset']
Composition
Now, consider a scenario where you want to experiment with multiple datasets. The conventional way of doing that would be to add a command-line argument of the type of dataset you want and add a bunch of if-else statements in your main code to select the appropriate dataset. However, this makes your code ugly and non-maintainable. A cleaner way to do this with Hydra is to create separate config files for different types of datasets.
Suppose you want to experiment with cifar10 and imagenet dataset, then your directory structure would look something like below
# DI
├── config
│   ├── config.yaml
│   ├── dataset
|					├── cifar10.yaml
│         ├── imagenet.yaml
└── train.py
Everything is composed in the master config.yaml file in the end. You can even add a defaults section to your config.yaml, telling Hydra which dataset to use by default if not specified by the user.
defaults:
	- dataset: cifar10
Overriding from the command-line
One of the coolest features of Hydra is that you can override anything inside the config file from the command-line. Let’s say you want to change the path of cifar10 for some reason. You can do this via command-line as shown below.
$ python3 app.py dataset.cifar10.path=/downloads/datasets/cifar10
Here, we can clearly see the advantage of Hydra. Everything is organized in a modular way and it keeps your code clean from a bunch of bad if-else statements. The configuration is hierarchically composable. Here, I showed the example of using different types of datasets, but you can pretty much do the same for all the other fields in your configuration (model, data paths, train settings, cloud storage paths, etc). The possibilities of managing different types of configuration hierarchically with Hydra are endless. You can even think of this type of configuration setting as modular same as we arrange our code in a modular fashion while writing any kind of software.
There are many features of Hydra out of which some of them are listed below:
- Logging - hydra has its own logging system (if you don’t want to use it, you can always disable it)
- Launching parallel processes from command-line.
- Sweeper - which allows to sweep over a certain range of parameters for hyper-parameter tuning.
- And much more!!
There are many more features of Hydra which is not possible to cover in this blog. I would urge you to read their documentation for a deeper understanding of Hydra and I hope that you use Hydra in your future projects and make your life much easier :)
How do I use Hydra for my projects.
I have been using Hydra for a while now and I just wanted to show how I manage my experiments and configuration with Hydra. Here’s a master config.yaml from one of my ongoing NLP projects.
defaults:
  - paths: colab
  - trainer: default_trainer

  # disable logging by Hydra
  - override hydra/job_logging: none
  - override hydra/hydra_logging: none
  - _self_

model:
  model_name: roberta-base
  class_name: RobertaForSequenceClassification

run:
  exp_num: "00" # serial number of experiment
  name: baseline # a short 1-2 word description of the experiment
  experiment_name: ${run.exp_num}_${model.model_name}_${run.name}
  comment: "baseline"
  n_folds: 5
  fold: 0
  debug: False
  disable_warnings: True

wandb:
  enabled: True
  log_artifacts: True
  project: USPPPM-Kaggle
  notes: ${run.comment}
  name: fold_${run.fold}
And here’s the corresponding file structure
├── config.yaml
├── paths
│   ├── colab.yaml
│   ├── jarvislabs.yaml
│   ├── kaggle.yaml
│   └── local.yaml
└── trainer
    ├── deberta.yaml
    ├── deberta_v3_base.yaml
    ├── deberta_v3_large.yaml
    ├── default_trainer.yaml
    ├── roberta_base.yaml
    └── roberta_large.yaml
Notice that how I name a particular experiment ${run.exp_num}_${model.model_name}_${run.name}.
For example: if I am doing my first experiment with roberta-base and I am using multi-sample dropout in it. Then the name of the experiment would be 1_roberta-base_multi-sample-dropout.
This way I can give a meaningful name to my experiment as discussed earlier and it becomes easy for me to search for a particular type of experiment.
I can override the corresponding fields to name different experiments and use different types of trains settings and model configurations just by changing the corresponding flag from command-line. Furthermore, as I am naming the experiments with some structure it would be easy to search for specific types of experiments by just using a search bar from an experiment tracking tool (which is covered in the second half of this blog).
Also, I like to write a short comment about the experiment I am running, so that’s easy to understand later what I was trying to do while running the experiment.
Here's how I run a experiment from a bash script
#!/bin/bash

cd /home/US-Patent-Matching-Kaggle/src

for fold in 0 1 2 3 4
do
    python3 train.py \
    paths="jarvislabs" \
    trainer="deberta_v3_base" \
    run.debug=False \
    run.fold=$fold \
    run.exp_num="2" \
    model.model_name="microsoft/deberta-v3-base" \
    model.class_name="AutoModel" \
    run.name="baseline" \
    run.comment="folds grouped by anchors + add contexts + deberta v3 base with no modifications"
done
Till now, you have the idea of managing complex configurations and how Hydra makes it really easy for you. Now, how do we track these experiments ? Well, the answer to all tracking needs is none other than Weights and Biases.
Before that, let’s understand what features you should look at before choosing an experiment tracking tool for your project.
What makes an experiment tracking tool good?
- Easy to use with minimal code changes in your codebase.
- Should be flexible to track custom metrics.
- Easy to use User Interface.
- Customizable dashboards.
- Should be able to track your datasets, models, and code.
- Dashboards and plots should be easily exportable to CSV or png files.
- Should be able to track system metrics**.**
- Most important: should not add any overhead and bottleneck to your program.
- Easy to collaborate with teams
- Should be open-source (well that’s my personal choice, but who doesn't like open-source :) )
There are tons of experiment tracking tools available. Here, I discuss Weights and Biases because I found it to be the best among all with a LOT of features and it ticks all of the above requirements for a good experiment tracking tool. For those of you who are living under a rock and don't know about Weights & Biases, it’s a developer-first MLOps platform which allows you to track your experiments, version control your datasets and models, etc. It's an all in one tool you’ll need for all your experiment tracking and management needs. And on top of that, it’s free for personal and academic usage.
Tracking experiments with Weights and Biases
This is not a guide on how to use Weights and Biases, instead, here I show what are the most important features of wandb that everyone should use and will increase your experiment tracking game by 100x. If you want to learn how to use wandb for your projects then their documentation is pretty good and they provide a lot of examples to start you off. Also, they have a YouTube channel explaining their features in-depth.
Note: From here-on I would be referring Weights & Biases by
wandbalias.
Integrating wandb to your existing project
Integrating wandb with your projects is very simple and involves a few lines of code. Wandb provides integrations for almost all popular open-source packages and their documentation has code snippets on how to integrate them to get you started.
Here's a link that lists all the integrations they provide and how to use them with that particular package.
Suppose you want to integrate wandb with Keras then here's how you can do it
# Code taken from: https://docs.wandb.ai/guides/integrations/keras

import wandb
from wandb.keras import WandbCallback

wandb.init(config={"hyper": "parameter"})

...  # code to set up your model in Keras

# 🧙 magic
model.fit(X_train, y_train,  validation_data=(X_test, y_test),
          callbacks=[WandbCallback()])
Yes, this is how simple it is to integrate wandb with any of your favorite frameworks. And it will automatically log all the hyper-parameters you define in config argument of wandb.init() method.
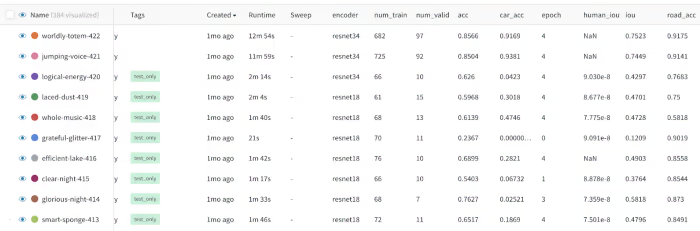
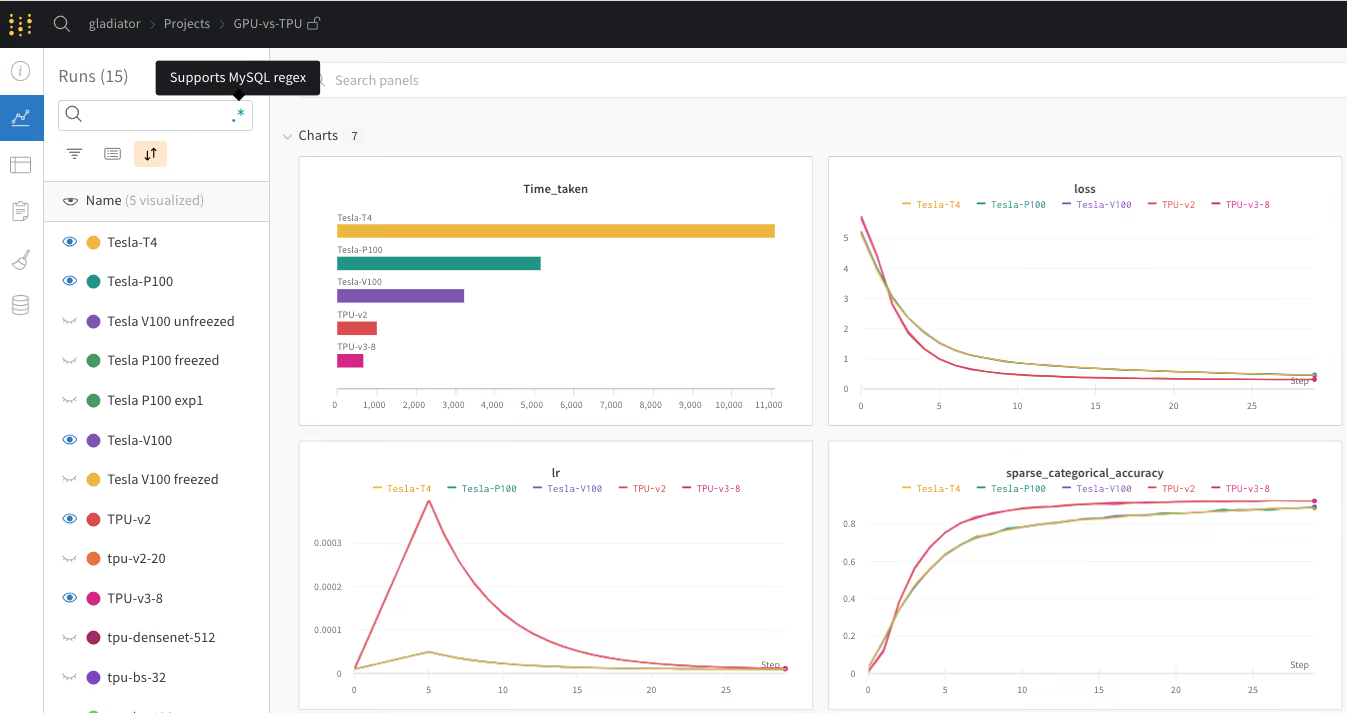
This is how a typical dashboard looks like
Default things monitored by wandb
Wandb automatically saves the command-line arguments as hyperparameters. You can even see what exact command-line arguments you passed on the experiment page.
You can also see the following useful information:
- The time at which the experiment started
- The duration of the experiment
- OS of the machine on which you ran the experiment
- Python version
- Git repository
- Git State
- The command used to run the experiment
- Number of CPU cores
- Type of GPU
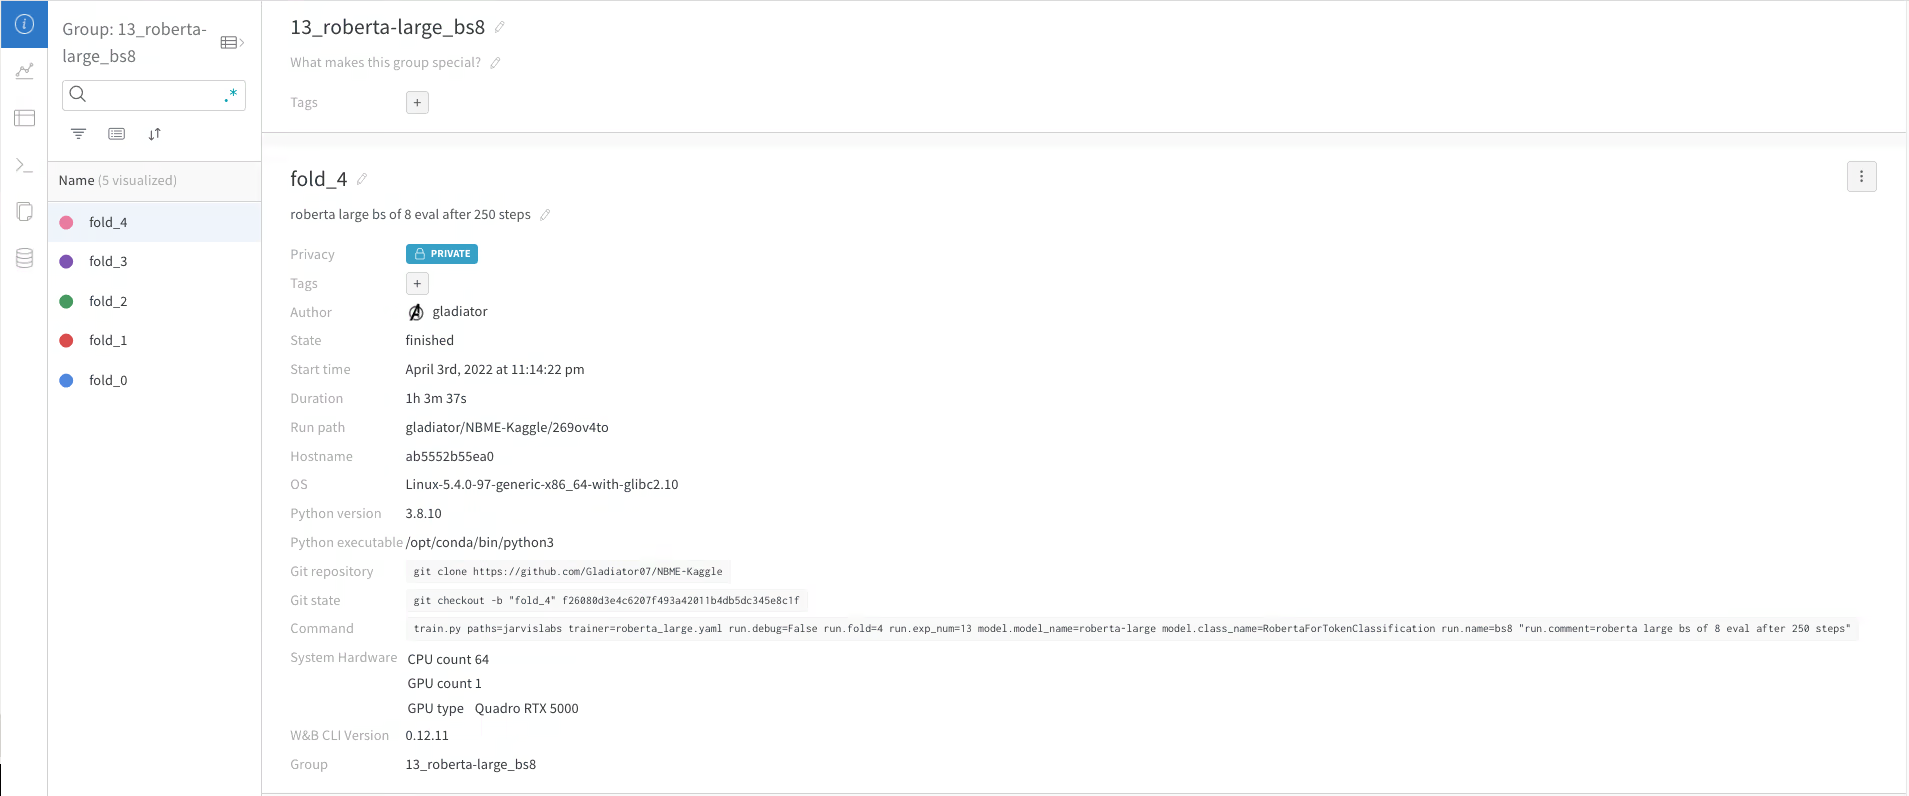
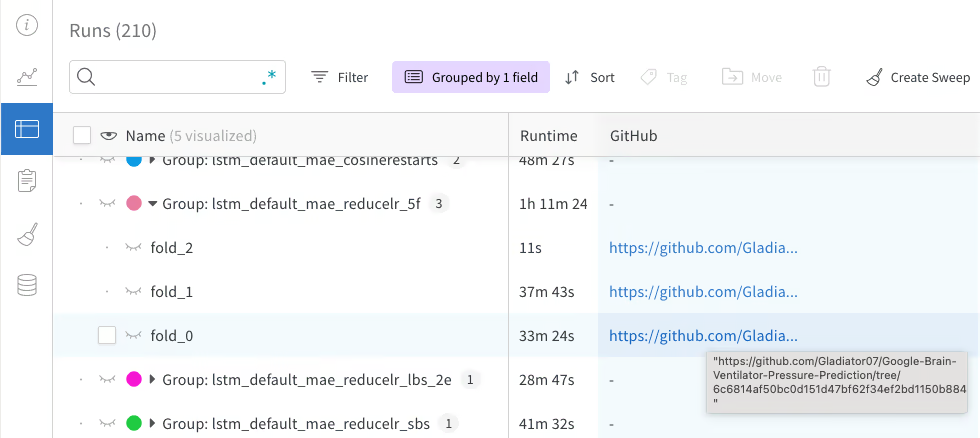
And to track all of this you don’t have to do anything at all. This is done by default. You can even group experiments with similar types. For example, I always run my experiments in a cross-validation loop. So, I group each fold’s experiment with the master experiment name which can be seen in the above screenshot.
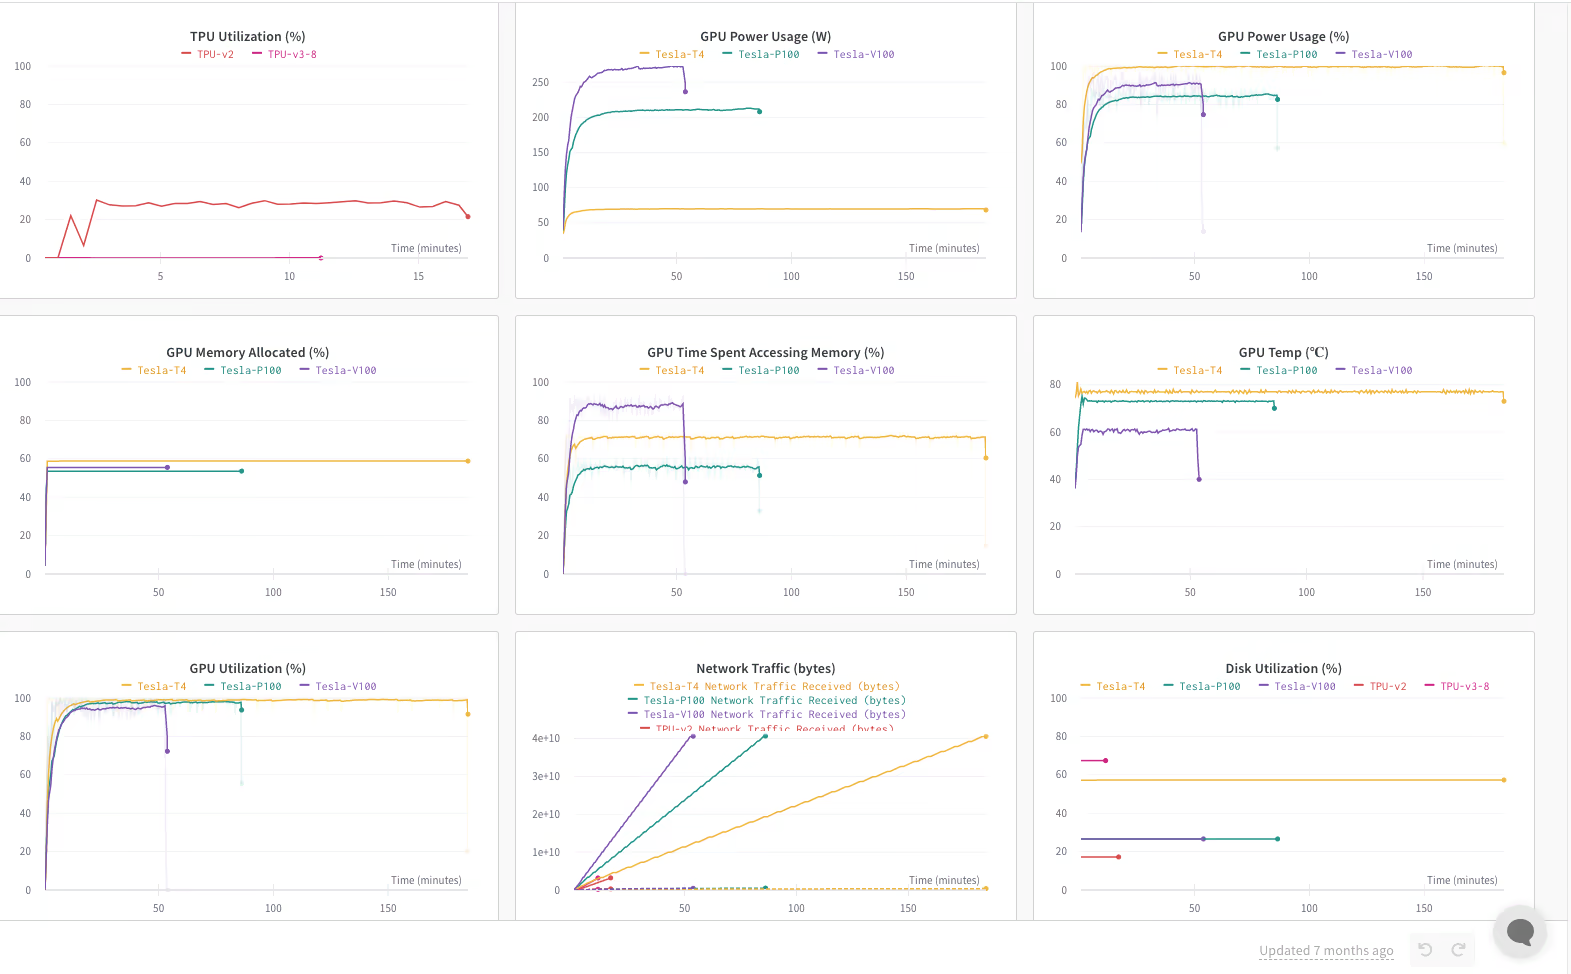
Furthermore, wandb automatically tracks all of your system metrics. Ex: CPU utilization, GPU utilization, GPU temperature, network usage, disk utilization, memory allocation, etc, etc. You name it, the thing’s already been taken care of by wandb :)
Even all the console logs are automatically monitored by wandb and you don’t have to worry to write your custom logger.
Searching experiments
As I discussed earlier, the main advantage of this kind of experiment tracking setup is the ability to quickly search for a particular experiment. You can easily do this in wandb with the search bar. The search functionality also supports MySQL and regex which is quite impressive.
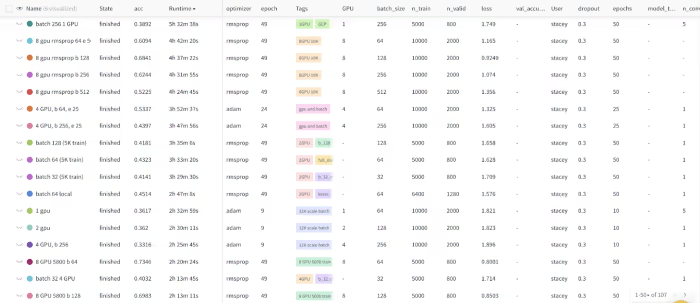
Furthermore, wandb also supports tags. You can pass the tags into wandb.init() method and it will automatically show up on the table. This is useful if you want to tag certain experiments with human-readable identifiers.
Logging advanced things
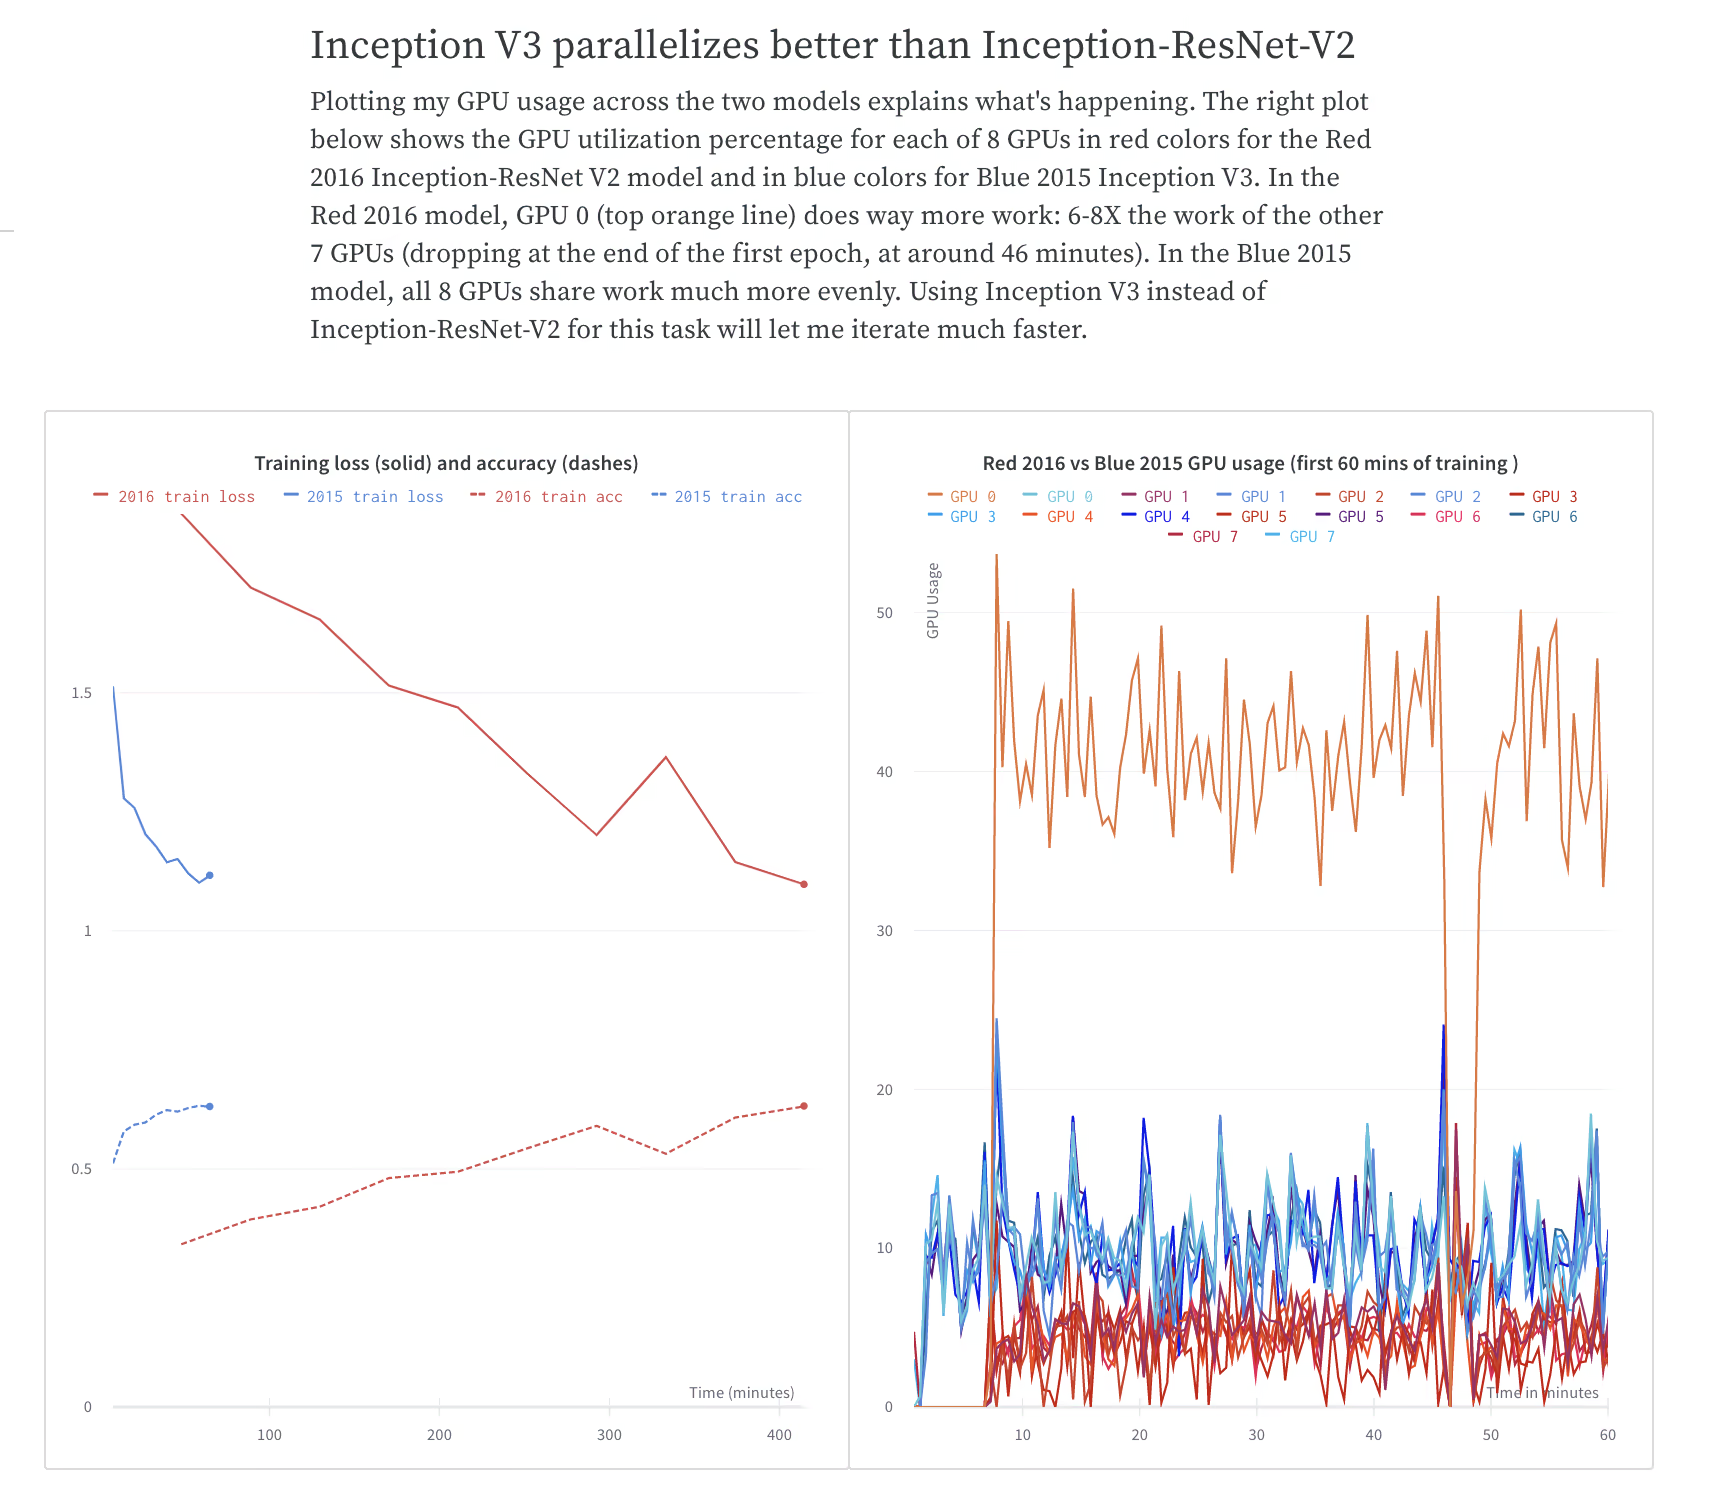
One of the coolest things about wandb is that you can literally log anything. You can log custom metrics, matplotlib plots, datasets, embeddings from your models, prediction distribution, etc.
Recently, Weights and Biases announced the Tables feature which allows you to log, query and analyze tabular data. You can even visualize model predictions and compare them across models. For example: see the image below (taken from wandb docs) which compares two segmentation models.
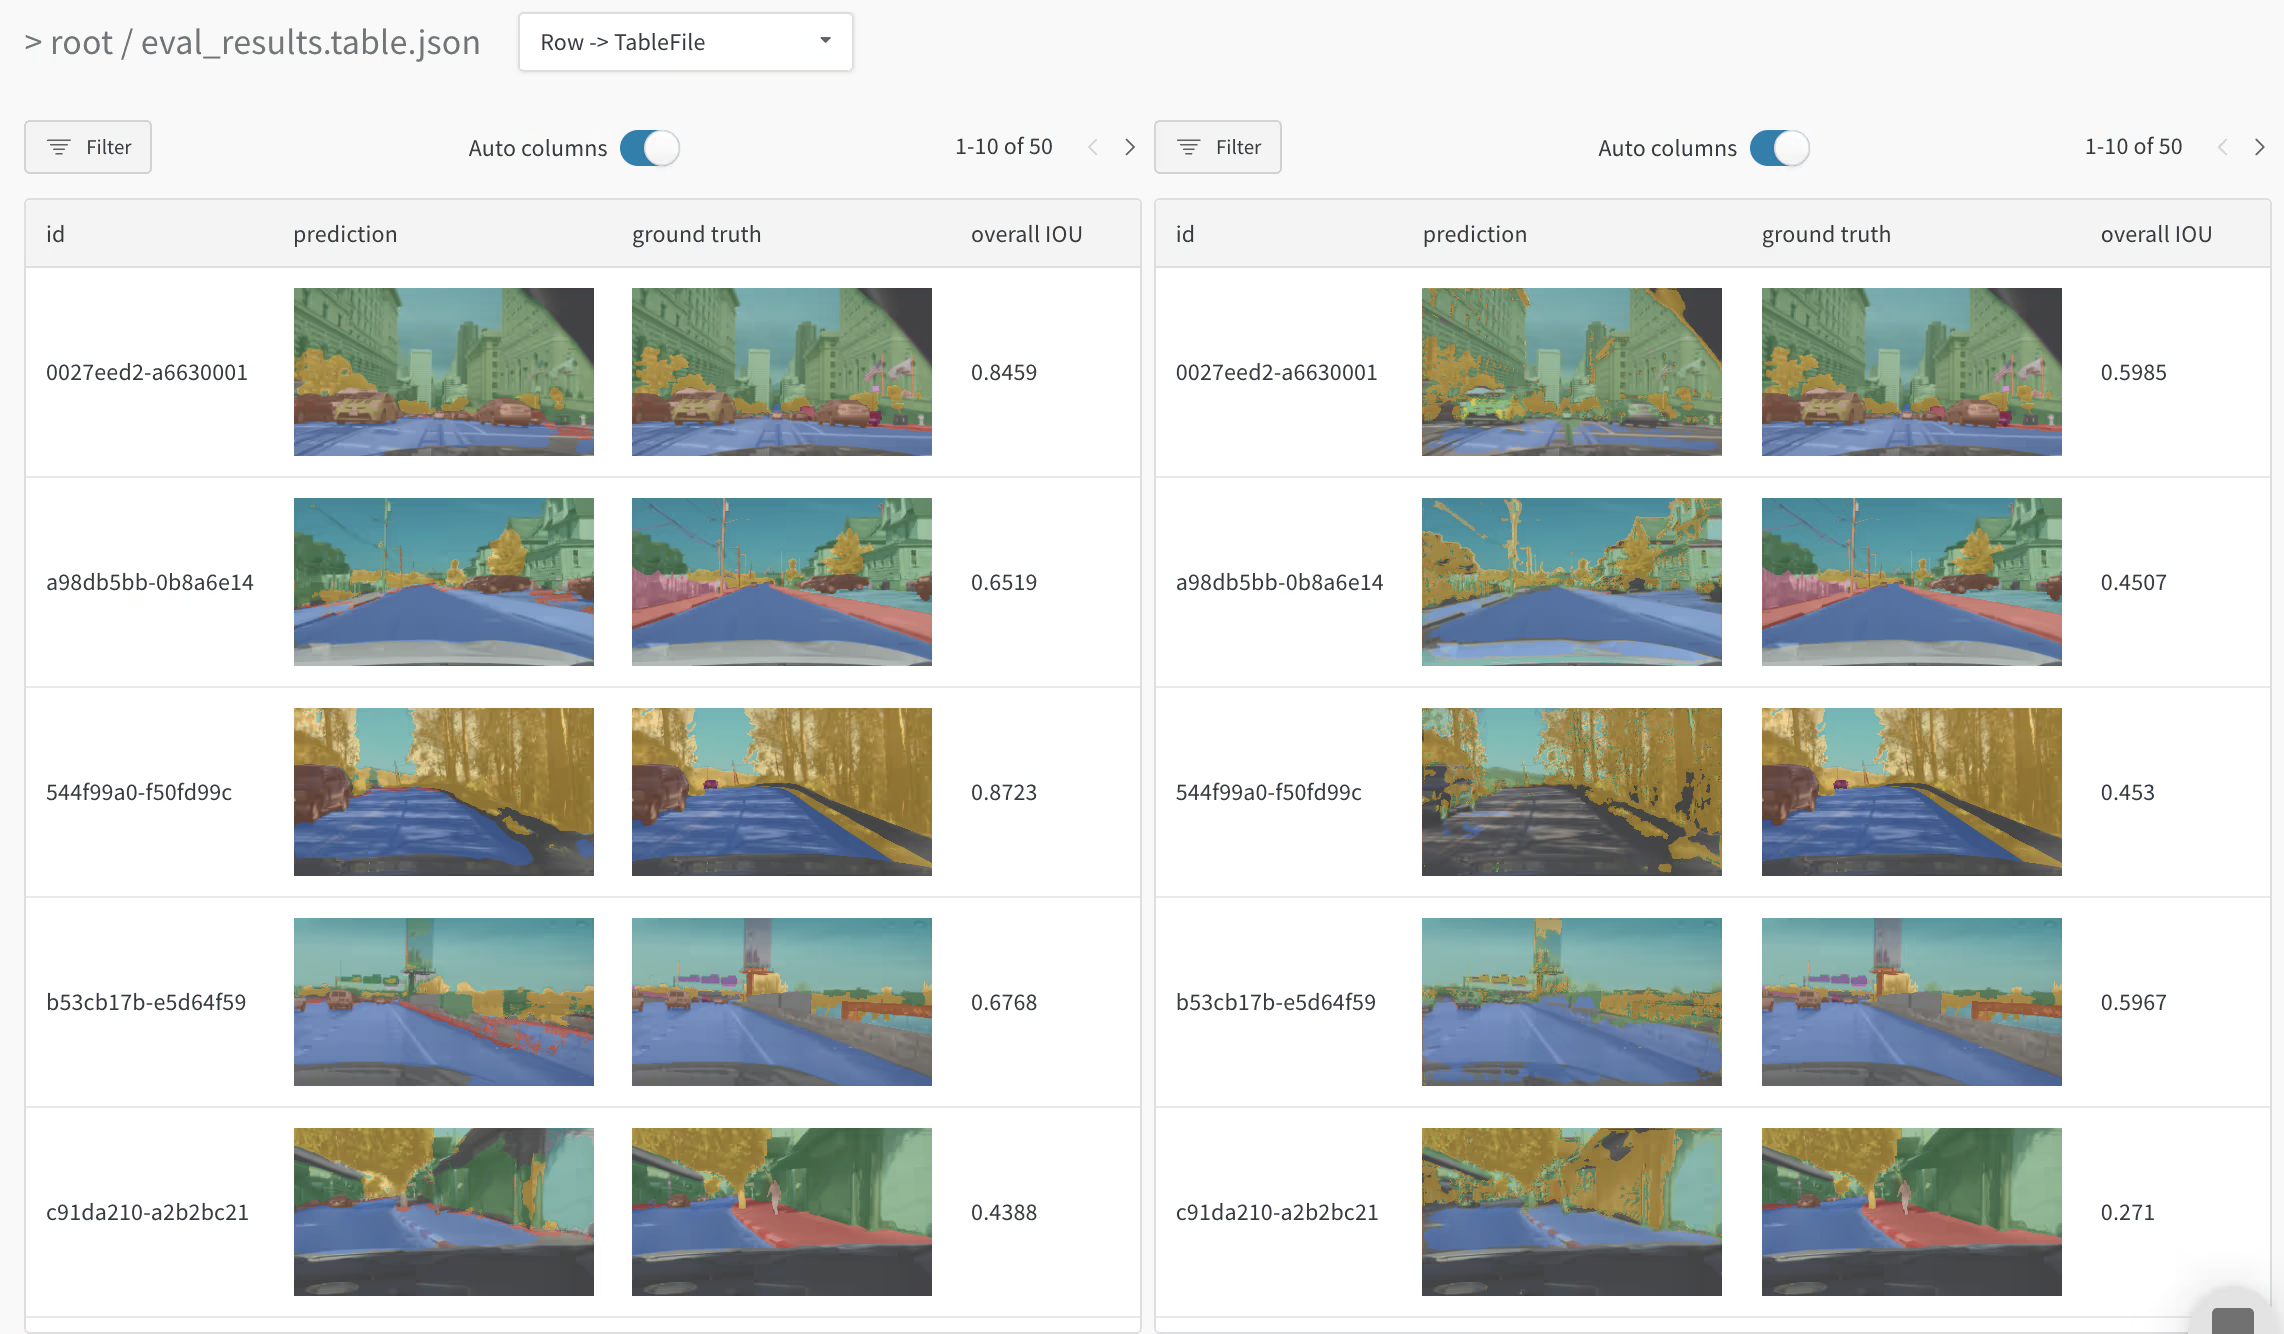
See granular differences: the left model detects some red sidewalk, the right does not.****
You can even log audio data, images, histograms, text, video, and tabular data and visualize/inspect them interactively. To learn more about wandb Tables ,go through their documentation.
You can even export dashboard in CSV files to analyse them further. wandb also supports exports in png, SVG, PDF, CSV depending on the type of data you are trying to export.
Saving code state
This is one of my favorite features of wandb. As I discussed earlier, it becomes pretty important to track your code along with other things, as you might consistently change your code and you need a way to exactly know how your code looked like when you ran a particular experiment. This is automatically done by wandb if you are using any version tracking (like Git), it automatically creates a state on which you can click and it takes you to that particular Git state in your GitHub repository.
Data + Model Versioning
Wandb also supports data and model versioning. It becomes pretty important to version control your datasets and models, especially in research-based projects. You can store entire datasets directly in artifacts, or use artifacts references to point to data in other cloud storage like S3, GCS, or your own local storage. You can use the tracked artifacts later in your inference pipelines and they can be downloaded anywhere with just a couple lines of code.
You can even name a specific version of the dataset/model and download it by using the same name.
This is how a typically logged artifact looks in the wandb dashboard
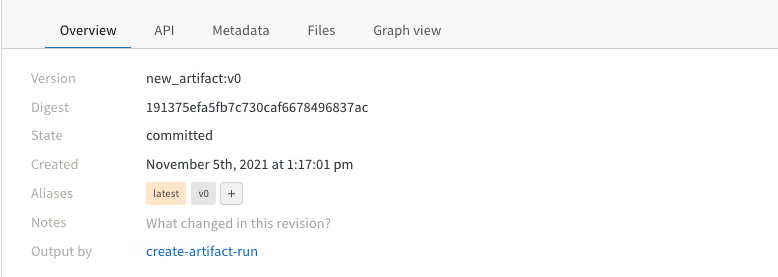
There are even more features in artifacts logging which can be referred to from the documentation.
Collaborative Reports
If you are working in a team or want to present your work to someone, this feature is a game-changer. This feature allows you to add a visualization from your existing dashboard with a quick summary. This helps to explain your idea to someone without creating any extra report in a word or pdf format. Creating a report from an existing wandb project takes only minutes and it can be easily shared with your team or with a wider community.
Here's a sample report (taken from wandb docs)
Scriptable run alerts
If you are a person like me who likes to line up several experiments at a time and just go out for a walk, then this feature would be useful for you.
Be default wandb alerts you when the run is finished or crashed on your email (which can be configured in your settings). You can even integrate a slack channel if you don’t want to fill your email inbox with a bunch of run is finished/crashed alerts.
You can even add scriptable alerts to your code and wandb will notify it via Slack or email. This feature is quite useful as you don’t have to constantly monitor your dashboards or have to be near your workstation. You will know if your run is finished or crashed or any custom messages you've configured in your code even from a mobile phone!
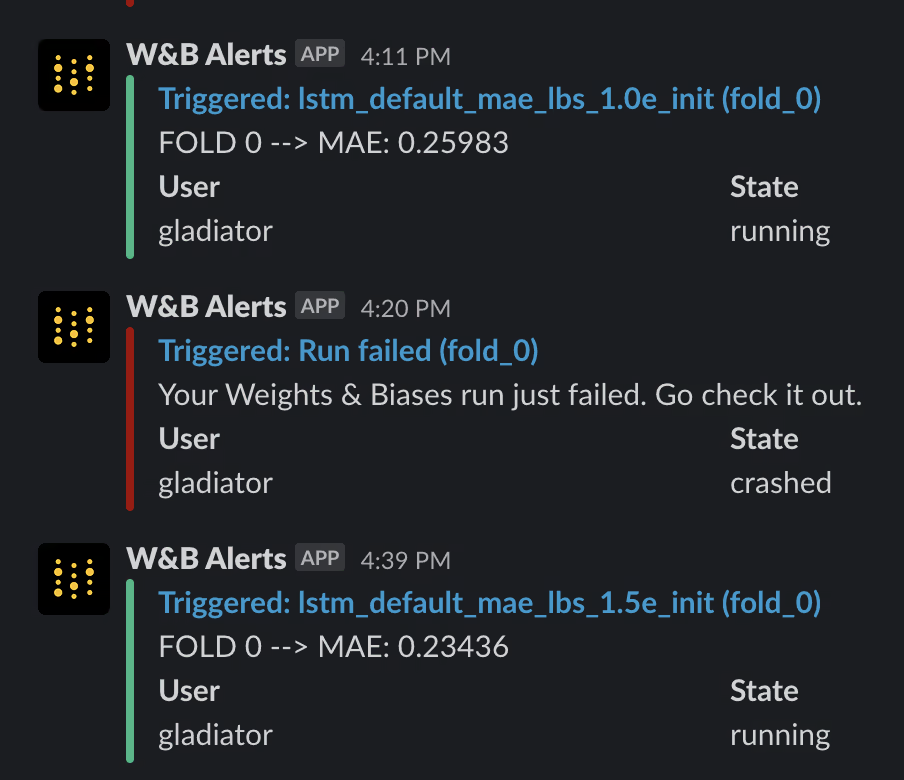
You can set up a scriptable alert like this:
wandb.alert(
    title=f"{experiment_name}",
    text=f"FOLD {fold} --> MAE: {mae}"
)
And then see wandb alerts messages in Slack (or your email)
There are countless features of Weights & Biases including Sweeps, Private Hosting, Embedding projector, etc which can’t be discussed in this blog post as this post is already quite long. I would suggest you go through their documentation and also YouTube videos and learn more about their features and use them in your existing/future projects. Once you use wandb, it will become the default tracking tool for you.
Conclusion
Here we are at the end of this blog post. Kudos to you if you were able to stick till the end. I hope that you now get the importance of experiment tracking and management and got the motivation to integrate the tips I discussed here. There are a lot of things that I’ve talked about in this blog post and it will not be possible for anyone to integrate all of them at once. Instead, I would suggest incorporating one tip at a time and seeing what works for you the best.
Learning about experiment tracking and management is an iterative process and it comes through hands-on practice and experience. Tracking and managing your experiments effectively would increase your productivity and reduce a lot of hassle you face in your research projects. This will allow you to focus on the problem at hand.
Reach out to Author
If you have any doubts about the blog or would like to learn more about experiment tracking, feel free to reach out to me on LinkedIn or Twitter, I would be happy to help and have a talk!